CoverageIQ is Nexibium’s analytics portal for exploring subscriber experience performance across measured routes, geographic zones, and network KPIs.
Request a Demo — No Sales Pitch, Just Insights
Network Benchmarking
Dive deep into Call drop rates, MOS scores, throughput, latency, handover success, and more. Geographical visualisation of network quality. competitor comparisons by KPI and geography. PDF summaries, Excel raw data, or compliance-ready reports
More effective
0X
Easier to use
0%
Customer Experience
Go beyond technical KPIs and see how users truly experience your network. From voice clarity and app responsiveness to complaint hotspot mapping, CoverageIQ™ translates network data into actionable insights that reduce churn and improve satisfaction.
Voice Quality (MOS & Call Drops)
Measure what matters most to customers: clear, reliable calls. CoverageIQ™ tracks MOS scores, call drop rates, and setup times to reveal exactly where voice experience breaks down.
App & Video Performance
From streaming to gaming, real-world performance defines customer satisfaction. CoverageIQ™ simulates common apps to test responsiveness, video stability, and browsing speed across your network.
Competitive Insights
See how your network stacks up. CoverageIQ™ creates clear scorecards that rank operators by key KPIs, turning complex data into simple, boardroom-ready insights.
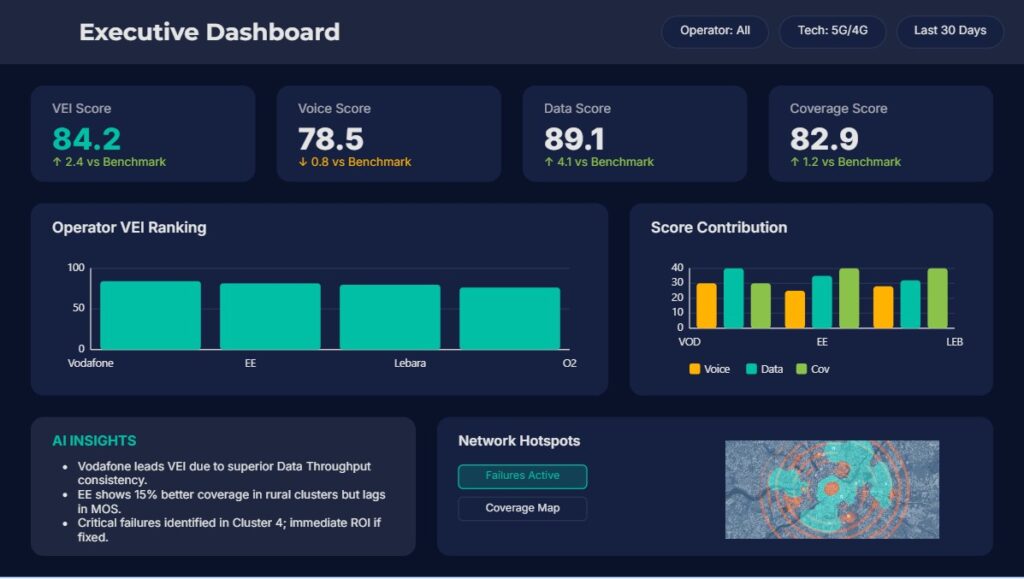
Operator Rankings
CoverageIQ™ creates clear scorecards based on VECTOR Experience Index (VEI) turning complex data into simple, boardroom-ready insights.
Side-by-Side Comparison
Directly compare two or more operators on coverage, throughput, latency, and voice quality. CoverageIQ™ makes competitive benchmarking transparent and actionable.
Trend Tracking
Track performance changes over time with historical benchmarking. CoverageIQ™ highlights improvements, regressions, and competitive shifts across months or years.
Geographic performance visualization
Interactive maps display KPIs such as signal quality, voice reliability and data throughput, helping identify performance risks and coverage issues.
How CoverageIQ Works
VECTOR Governance Framework
Every assessment begins with a structured measurement plan designed using the VECTOR route sampling model. Routes are selected to represent key environment types such as residential areas, transport corridors, commercial zones and congestion hotspots.
Field Measurement Campaign
Measurement campaigns are executed using controlled device configurations and predefined test scripts. Statistical controls ensure that isolated anomalies are not treated as material findings unless replication and confidence thresholds are met.
CoverageIQ Analytics Portal
After field collection, measurement logs are processed using defined data validation and filtering rules. interactive dashboards to view route-level performance, geographic performance maps,KPI dashboards for voice, data and signal quality & VECTOR Experience Index (VEI) scoring
Governance Reporting
The final stage converts measurement analytics into governance insights.Validated findings are translated into actionable performance insights and governance reports.